
About This Guide
The 2026 Commercial Real Estate Compensation Guide is published by H Two National, a national CRE executive search firm headquartered in Charlotte, NC. Our team has placed thousands of professionals across every income-producing asset class, from site-level property managers to C-suite executives.
Leo Turley, CEO and Founder, brings 40+ years of commercial real estate recruiting experience and has personally conducted over 5,000 executive searches across the United States. Leo is a leading expert specializing in real estate executive search.
Katlyn Turley, President, leads the firm’s day-to-day operations and client relationships with 12+ years of experience in CRE talent acquisition.
H Two National’s 254,000+ candidate research database is one of the largest purpose-built CRE talent databases in the country. We recruit nationally from site-level to C-level in every asset class and discipline, including development, investment, syndication, finance/accounting, marketing, leasing, training, asset management, property management, and human resources.
Our executive search process delivers qualified candidates within 7 days, with placements averaging 60-90 days. We offer retained search, contingency search, and our RecruitPlus subscription model for firms with ongoing hiring needs.
Download the Full PDF Compensation Guide
Key Takeaways
- CRE base salaries are rising 3-6% in 2026, with development roles seeing the steepest increases at 4-6% (H Two National Compensation Data)
- Property Manager salaries range from $70,738 to $110,000, while COO-level roles reach $206,195-$376,258
- Southeast and Texas markets lead compensation growth at 4-6%, driven by population influx and active construction
- Chief Investment Officers command the highest CRE salaries at $376,028-$484,533
- This guide covers 35+ roles across five CRE disciplines, based on 5,000+ executive placements nationwide
Commercial real estate firms planning their 2026 budgets face a straightforward question: are we paying enough to keep our best people? Based on more than 5,000 executive placements conducted over four decades, this guide provides salary ranges for 35+ CRE roles across development, finance, marketing, asset management, and property management.
We built this data from real search engagements, not job postings or self-reported surveys. When we recruit for a position, we provide our clients with a mini-salary survey specific to that role and market. That gives them a clear picture of what the position actually pays right now, so they can stay competitive without overpaying.
Whether you’re a CRE operator benchmarking your team’s compensation or a professional evaluating your next move, this guide gives you the numbers you need.
Download the full PDF version of this guide here.
What’s Driving CRE Compensation Changes in 2026?
CRE base compensation is rising approximately 4% across major markets in 2026, with development and acquisitions talent commanding increases of up to 6% (H Two National, 2026 Compensation Guide). Firms are increasing pay to retain proven performers and attract candidates with strong regulatory, operational, and development experience. The pressure is especially intense for leaders who can manage budgets, stabilize assets, push NOI, and advance development pipelines in tighter capital markets.
But here’s what the numbers don’t always show: compensation alone isn’t solving the retention problem. The pressure today is landing most heavily on the middle layer of organizations, the people holding everything together. That’s not a talent problem. It’s a structure and support problem.
What factors are pushing salaries higher? Three stand out. First, competition for experienced operators has intensified as institutional ownership and portfolio growth continue. Second, limited candidate supply in specialized areas like underwriting and entitlement work is creating bidding wars. Third, rising operating costs in property management are forcing operators to pay more to retain strong managers who drive occupancy and compliance performance.
How Are 2026 CRE Salary Increases Distributed by Sector?
Broad commercial real estate firms are planning salary increases of approximately 3.5-4.5% in 2026, while development and capital markets roles are seeing stronger growth at 4-6% (H Two National, 2026 Compensation Guide). The spread reflects a talent supply imbalance: there are simply fewer candidates with specialized underwriting, entitlement, and development pipeline experience compared to operational roles.
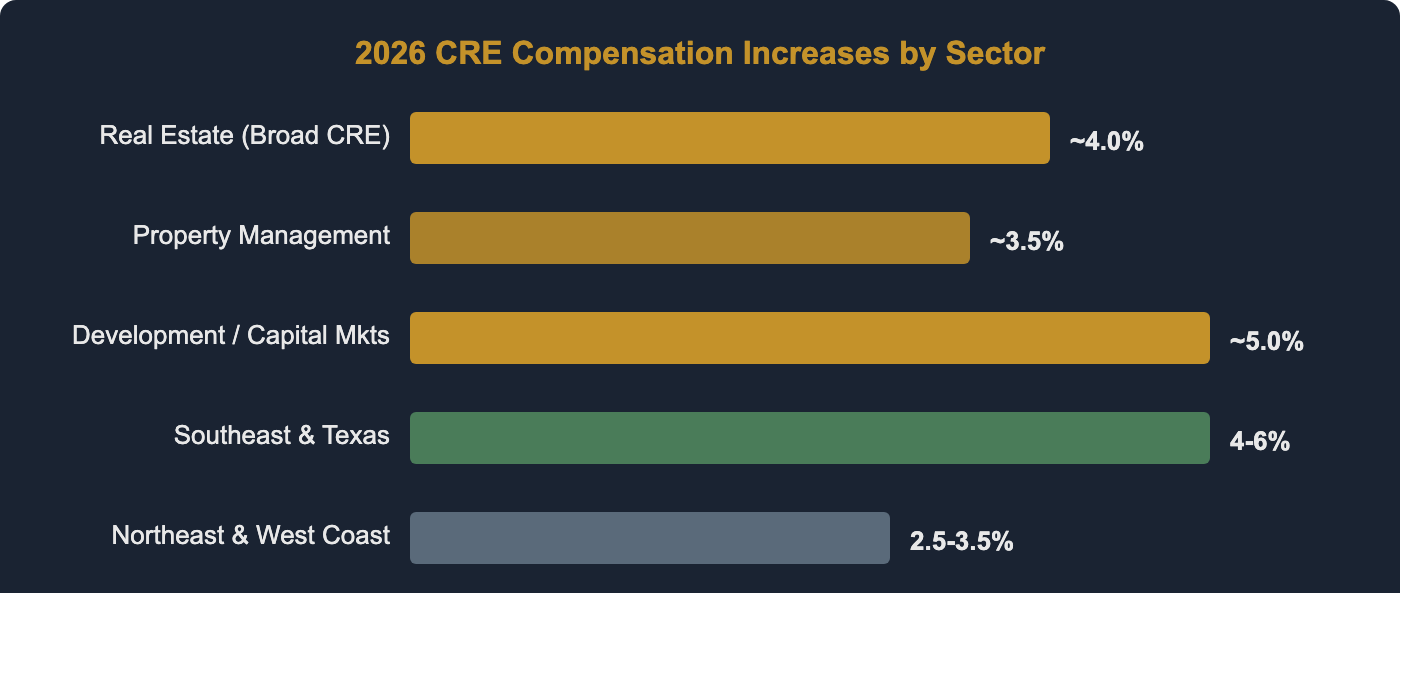 Expected base salary increases vary by sector and region. Development talent commands the steepest raises.
Here’s how the increases break down by sector:
- Real Estate (Broad CRE): Around 4%. Most firms are planning increases in the 3.5-4.5% range, driven by steady leasing, asset management demand, and retention of experienced professionals where institutional ownership continues growing.
- Property Management (Multifamily and Commercial Ops): Between 3% and 4%. Operators are balancing rising costs with the need to keep strong managers who drive occupancy, NOI, and compliance performance. Tight talent markets can push this to 4%.
- Development, Acquisitions, and Capital Markets: Between 4% and 6%. Salary growth is stronger here due to limited candidate supply, specialized underwriting and entitlement skill sets, and competition among active growth platforms.
What about geographic differences? They’re significant. Southeast markets (Charlotte, Raleigh, Atlanta, Nashville), Texas metros (Dallas-Fort Worth, Austin, Houston), Phoenix, Denver, and Salt Lake City are seeing higher increases of 4-6%. These markets benefit from population growth, active construction, and fierce competition for experienced leaders.
Midwestern markets like Chicago, Minneapolis, Kansas City, Columbus, Tampa, and Orlando sit in the moderate range at 3-4%. And Northeast coastal cities (Boston, NYC, Philadelphia) plus West Coast markets (San Francisco, Seattle, Portland, LA) are seeing lower increases of 2.5-3.5%, reflecting slower deal flow and tighter capital.
How Much Do CRE Development and Investment Roles Pay?
Chief Investment Officers command the highest compensation in CRE at $376,028-$484,533, followed closely by Chief Development Officers at $277,072-$485,337 (H Two National, 2026 Compensation Guide). These ranges reflect base salary only. Total compensation with bonuses, equity participation, and profit sharing can push C-suite development roles well above $600,000.
Development and investment roles consistently sit at the top of the CRE pay scale because the skill set is specialized and the stakes are high. A VP of Acquisitions making the wrong call on a $50M deal costs far more than their salary. That risk premium shows up in the numbers.
Something worth noting: Investment Analysts at $102,177-$169,300 represent the entry point for this career track. From there, the jump to VP of Acquisitions ($233,464-$408,591) is substantial, reflecting the shift from analytical support to deal-making authority.
What Are Finance and Accounting Salaries in Commercial Real Estate?
CRE Chief Financial Officers earn between $325,514 and $490,108, making the CFO role the second-highest compensated position in most real estate organizations after the CIO (H Two National, 2026 Compensation Guide). Controllers, who manage the day-to-day financial operations, earn $140,378-$255,755. That’s a wide range reflecting the difference between a controller at a 5-property shop versus one overseeing a 200-property national portfolio.
Have you noticed the gap between VP of Finance and Controller? It’s smaller than you might expect, at just $13,462 at the low end. In many organizations, these roles overlap significantly, and we’ve seen companies eliminate the VP title in favor of a Senior Controller with expanded responsibilities. If you’re budgeting for a finance leader, the Controller range often represents better value.
What Do Marketing and Leasing Professionals Earn in CRE?
Head of Leasing roles command $185,598-$366,018 in 2026, slightly outpacing Head of Marketing at $172,596-$333,454 (H Two National, 2026 Compensation Guide). The premium for leasing leadership reflects the direct revenue impact these roles have. A strong leasing director can move occupancy numbers that affect millions in NOI.
One thing we’ve noticed across 5,000+ searches: marketing roles in CRE are being redefined. The Marketing Specialist at $59,360-$87,750 used to mean “someone who designs flyers.” Today, firms want digital marketing expertise, data analytics capability, and PropTech fluency. That’s pushing the upper end of these ranges higher each year.
How Much Do Asset Managers and Compliance Officers Make?
VP and Director-level asset management professionals earn $213,673-$343,810 in 2026, with Senior Asset Managers at $141,874-$248,882 (H Two National, 2026 Compensation Guide). Compliance roles, while lower on the pay scale, have seen steady growth as regulatory requirements expand across every asset class.
What Are Property Management Salaries in 2026?
Property Managers in commercial real estate earn $70,738-$110,000 in 2026, while the COO role tops the property management track at $206,195-$376,258 (H Two National, 2026 Compensation Guide). Property management is the largest employment category in CRE, and these ranges reflect compensation across multifamily, commercial, and mixed-use portfolios nationwide.
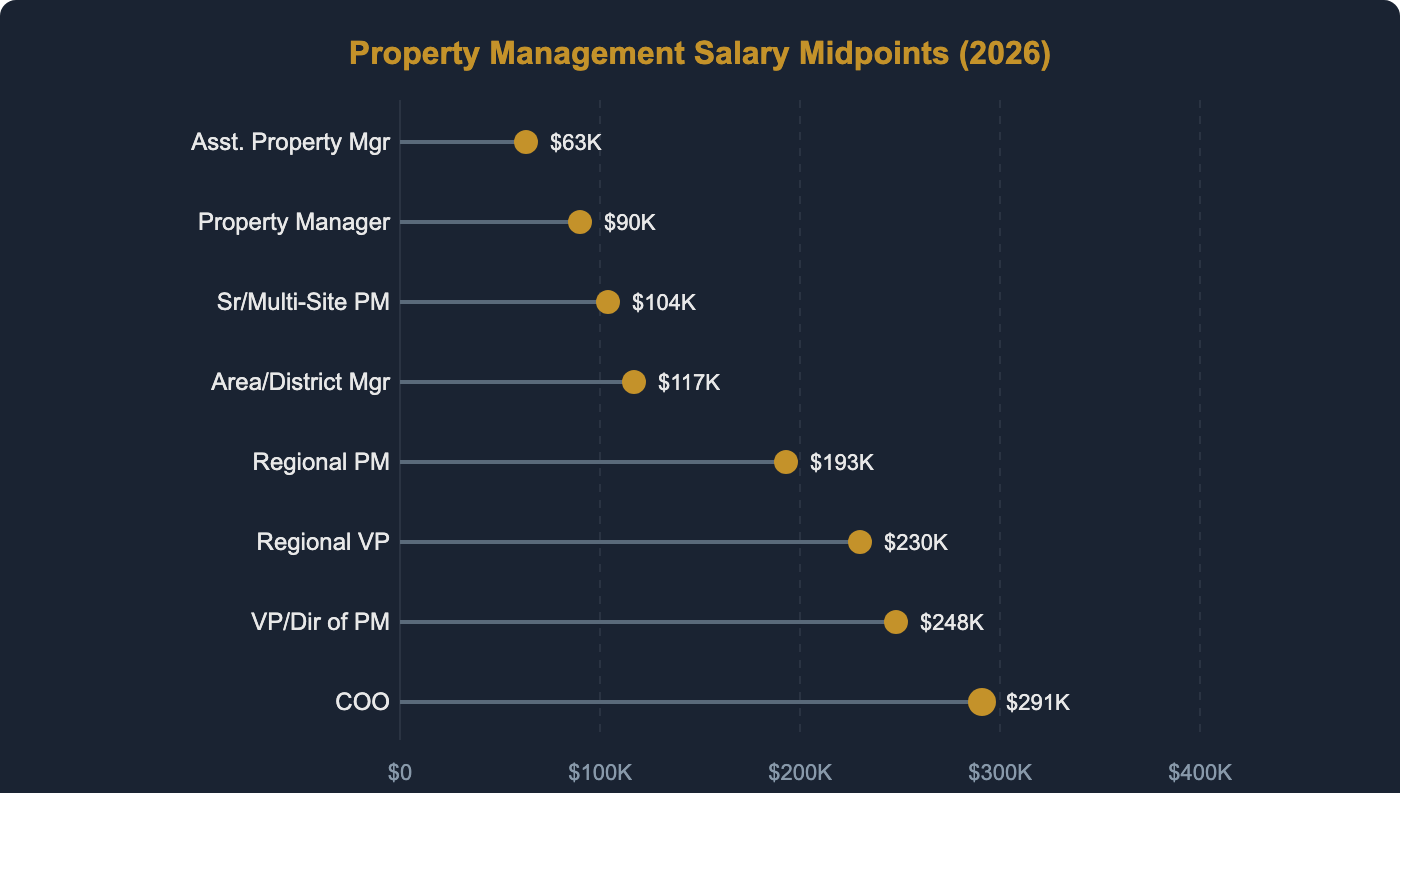 The jump from Area/District Manager to Regional PM represents the biggest single salary leap in the PM career track.
The career progression in property management shows a clear pattern. From Assistant Property Manager ($55,561-$71,077) to Property Manager ($70,738-$110,000), the increase is modest. But the jump from Area/District Manager ($104,766-$128,923) to Regional Property Manager ($143,830-$241,864) is where compensation really accelerates. That transition represents a shift from single-asset oversight to portfolio-level P&L responsibility.
We’ve found that candidates who can demonstrate NOI improvement, occupancy gains, and team development results at the district level tend to command the upper quartile of the Regional PM range. It’s not just about years of experience. It’s about measurable portfolio impact.
Which CRE Markets Are Growing Fastest in 2026?
Dallas-Fort Worth appears on both the top multifamily and top commercial growth lists for 2026, making it the strongest overall CRE market in the country right now (H Two National, 2026 Compensation Guide). Charlotte, NC also appears on both lists, reflecting the Southeast’s continued dominance in commercial real estate development and hiring activity.
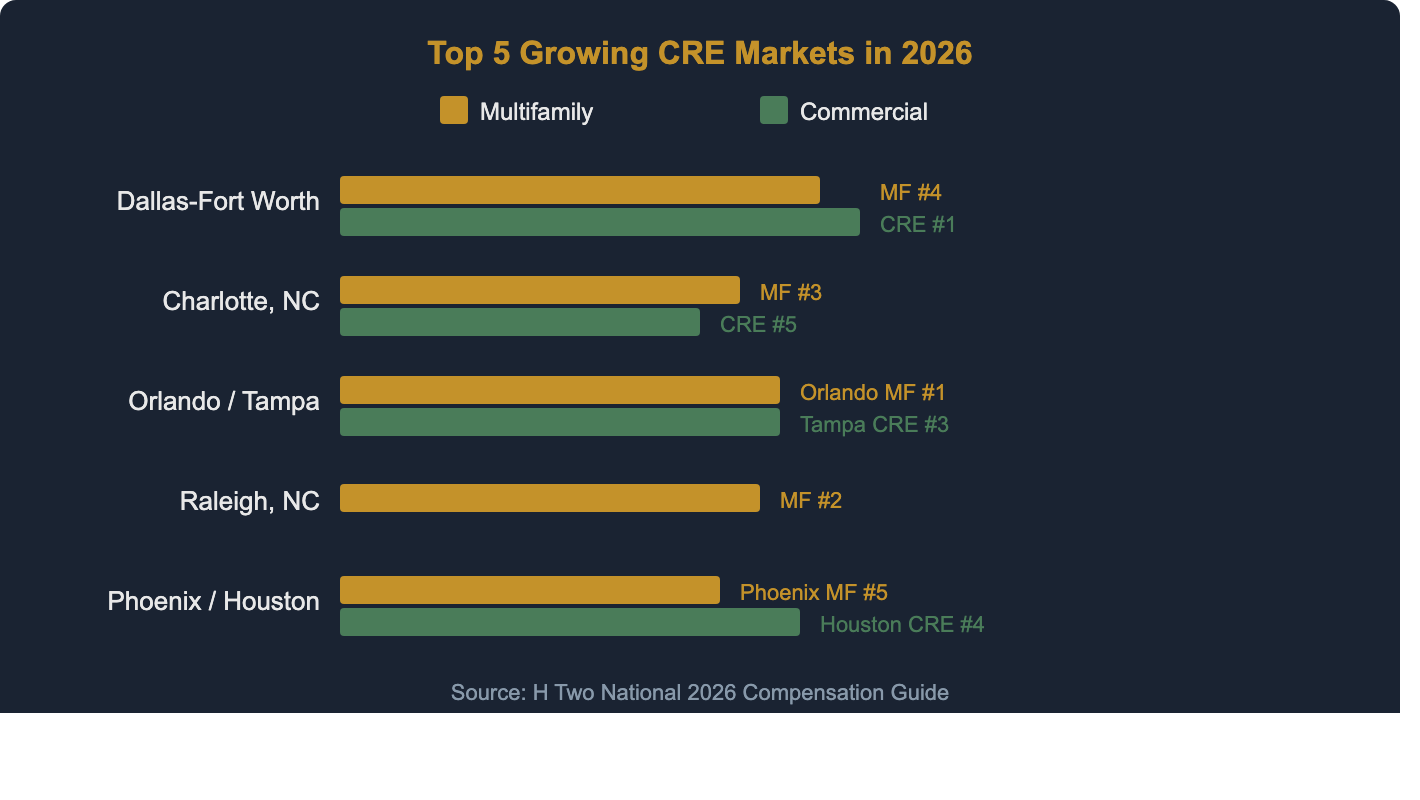 Dallas-Fort Worth and Charlotte appear on both multifamily and commercial growth lists for 2026.
Top 5 Multifamily Growth Markets: Orlando, FL; Raleigh, NC; Charlotte, NC; Dallas-Fort Worth, TX; Phoenix, AZ
Top 5 Commercial Growth Markets: Dallas-Fort Worth, TX; Miami Metro, FL; Tampa Bay, FL; Houston, TX; Charlotte, NC
What do these markets have in common? Population growth, business-friendly regulatory environments, and active construction pipelines. For hiring managers, these are also the most competitive talent markets. If you’re recruiting for a Regional Property Manager in Dallas or Charlotte, expect to pay at the upper end of our $143,830-$241,864 range, and potentially beyond it.
How Should CRE Firms Structure Compensation Packages?
Base salary accounts for just one part of total CRE compensation. In our experience placing 5,000+ executives, the firms that retain their best people treat compensation as a system, not a single number (H Two National, 2026 Compensation Guide). The ranges in this guide represent base salary only. Total package value can be 20-40% higher when you factor in the components below.
Total package components to consider:
- Performance bonus: Is there a formula, a goal-based structure, or is it discretionary? Candidates prefer clarity.
- Equity, participation, or profit share: Increasingly common at VP+ levels in growth-stage firms.
- Sign-on bonus: Often used to bridge the gap when a candidate’s current package exceeds your base range.
- Relocation reimbursement: Essential for attracting talent from other markets.
- Phone and laptop: Standard, but still a line item that candidates evaluate.
- Travel reimbursement, car, or car allowance: Especially relevant for regional roles covering multiple properties.
Benefits and PTO:
- Hybrid or remote options (this often carries more retention impact than a base salary increase)
- Vacation time, sick time, and holiday schedule
- Cost of benefits, 401K match, dental/vision coverage
- Disability and life insurance
Here’s a principle we’ve learned: avoid one-off raises in response to turnover risk. They quietly erode trust among the wider team. Instead, use structured compensation bands to maintain internal equity and consistency. Discuss compensation alongside development: “Here’s what growth looks like, and compensation moves with it.” Title progression should reflect responsibility readiness, not workload relief.
What Tools Help CRE Leaders Build Stronger Teams in 2026?
Retention in 2026 is driven by clarity, growth, and fairness, not just pay increases (H Two National, 2026 Compensation Guide). The firms we work with that retain their top performers consistently share six characteristics. We call them the Six Stability Levers.
- Predictable Onboarding: A structured 30/60/90 plan builds early confidence and direction. We’ve seen turnover in the first 90 days drop significantly when firms implement this.
- Clear Expectations: Role scorecards reduce ambiguity and misalignment. When someone knows exactly what success looks like, they perform better.
- Transparent Growth Paths: Showing what “next level” looks like reduces anxiety and turnover. Don’t make people guess.
- Leadership Rhythm: Weekly touch points reduce overwhelm and create psychological safety. Simple. Powerful.
- Recognition Loops: Reinforcing what’s working strengthens motivation and resilience far more than annual reviews.
- Purpose and Belonging: People stay where they feel connected and valued, not just compensated.
We also recommend these practical frameworks:
- Growth Path Maps to clarify development expectations and timelines
- Universal Interview Scorecards to align hiring decisions around capability plus cultural fit
- 30/60/90 Onboarding Frameworks to build confidence early and avoid overwhelm
- Compensation Framing Guides to keep pay conversations objective, consistent, and grounded
When leaders are present, teams stay. When growth is clear, people commit. When structure is consistent, culture stabilizes. We’ve seen it in 40 years of placing CRE professionals.
For more guidance, explore our resources on how to write an offer letter, relocation expense guidelines, and why candidates decline job offers.
What Should Employers Keep in Mind When Using This Guide?
These are ranges, and actual compensation will depend on the candidate’s current pay, geographic location, company size, and scope of responsibilities (H Two National, 2026 Compensation Guide). Use this guide as a starting point for budgeting and benchmarking, not as a final answer for any individual hire.
A few things we always tell clients:
- Base compensation really depends on what other perks and benefits are offered. A lower base with strong equity participation might attract better talent than a higher base with no upside.
- Market conditions shift faster than annual guides can capture. When we recruit for a specific position, we provide a mini-salary survey specific to that role and location so our clients know they’re paying competitively.
- Internal equity matters as much as market rates. Bringing in a new hire at a premium can destabilize your existing team if current employees find out.
Need salary data for a specific role in a specific market? Contact us for a complimentary mini-salary survey tailored to your position and location.
Frequently Asked Questions
What is the average property manager salary in commercial real estate in 2026?
Property Managers in commercial real estate earn between $70,738 and $110,000 in base salary in 2026, according to H Two National’s compensation data from 5,000+ executive placements. Senior and Multi-Site Property Managers earn $91,132-$116,500, while Regional Property Managers earn $143,830-$241,864. These figures represent base salary only and vary by portfolio size, asset class, and geographic market.
How much do CRE executives make in 2026?
C-suite CRE executives earn $200,000-$490,000+ in base salary. Chief Investment Officers top the range at $376,028-$484,533, followed by Chief Financial Officers at $325,514-$490,108 and Chief Development Officers at $277,072-$485,337. Chief Operating Officers in property management earn $206,195-$376,258. Total compensation with bonuses, equity, and profit sharing can push these figures 30-50% higher.
Which CRE markets pay the highest salaries in 2026?
Southeast and Texas markets are seeing the strongest compensation growth at 4-6%, including Charlotte, Raleigh, Atlanta, Nashville, Dallas-Fort Worth, Austin, Houston, Phoenix, Denver, and Salt Lake City. However, Northeast coastal markets (Boston, NYC) and West Coast markets (San Francisco, LA, Seattle) still tend to have higher absolute salary levels despite slower growth rates of 2.5-3.5%.
What compensation increase should CRE firms budget for 2026?
Most CRE firms should budget for 3.5-4.5% base salary increases in 2026. Property management roles are increasing 3-4%, broad commercial real estate roles around 4%, and development, acquisitions, and capital markets roles at 4-6%. Firms in high-growth Southeast and Texas markets may need to budget at the upper end to remain competitive.
How does H Two National collect its compensation data?
H Two National’s compensation data comes from more than 5,000 executive search engagements conducted over 40+ years of CRE recruiting. Unlike self-reported salary surveys or job posting aggregators, this data reflects actual placement compensation from real search engagements across all 50 states, covering multifamily, commercial, industrial, retail, hospitality, and specialty asset classes. When recruiting for specific positions, we also conduct mini-salary surveys tailored to that role and market.
Ready to discuss a search? Contact Katlyn Turley at [email protected] or call 704.965.8309.